Plotting Several Distributions
Differentiate between stacked and non-stacked.
Stacked Distributions
If you plot several dependent distributions, such as subsets of one larger data-set they should be plotted as a stacked histogram.
For dependent distributions:
- Have the same filling style
- At best, colors vary in intensity, from dark at the bottom to light at the top

Example of a stacked histogram
Independent Distributions
If you plot several independent distributions, they should all have different styles. This could be different line styles or fillings with different hatches.
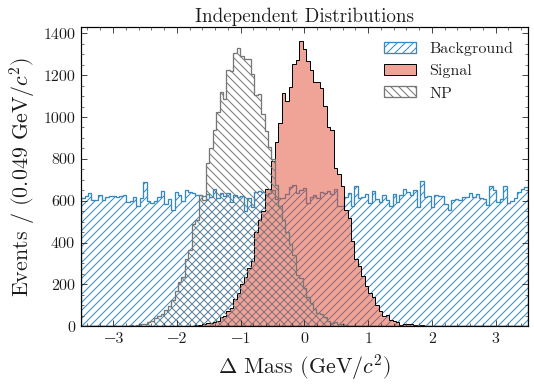
Example of independent distributions